

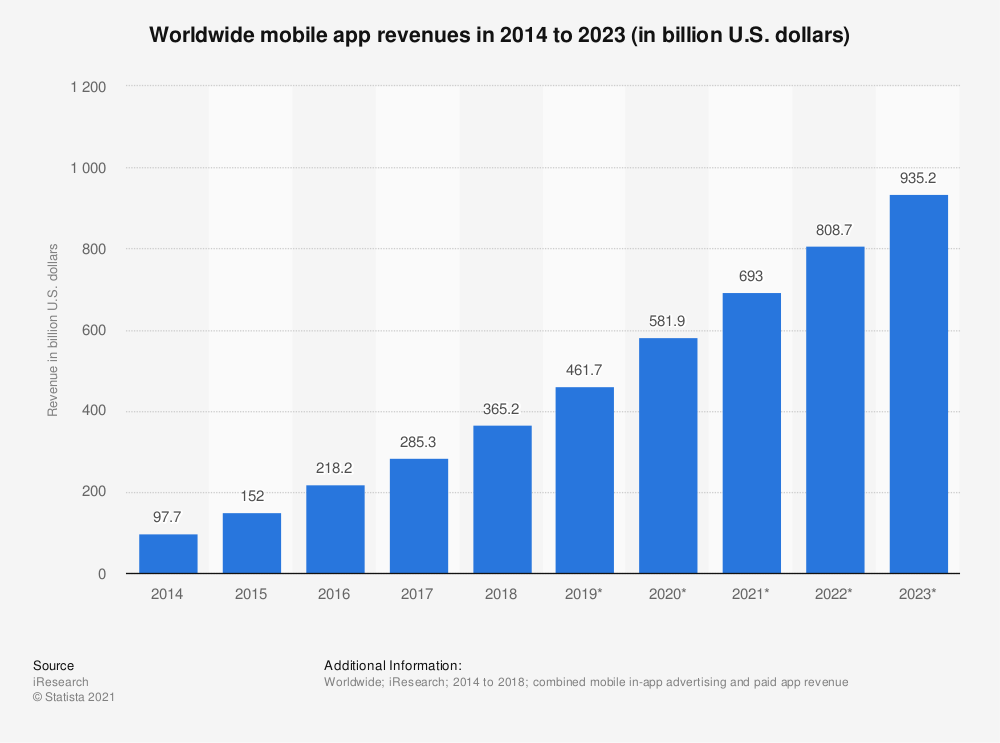
It’s the beginning of 2021! And every one of us is using hundreds and thousands of on-demand apps, making life more accessible than ever. In 2018, global mobile app revenues were 365 billion U.S. dollars. It’s estimated to increase and reach 935 billion in 2023 in revenue through paid downloads as well as in-app advertising.
And one such on-demand app is Spotify. We all might be aware of the use of the streaming platform for years. The platform provides users with personalized insights, like favorite artists, songs, etc. It helps determine how much time tracks and determines how much time any individual spent on the platform. The audio features from the “Discover Weekly” playlist and what music features the most based on listening history on Spotify.
Music Taste Analysis: Check How API & Pythons Help with It!
You might be wondering about how to analyze playlists with API. Once you understand it, you can realize how the streaming app works and how it manages data with Python, AI, and cloud technology. It will provide you with an exciting playlist throughout the week and day. If you are new to the concept, let’s check the step-by-step guide to how streaming platforms use API and python to determine your music taste.
Setting Up Web API
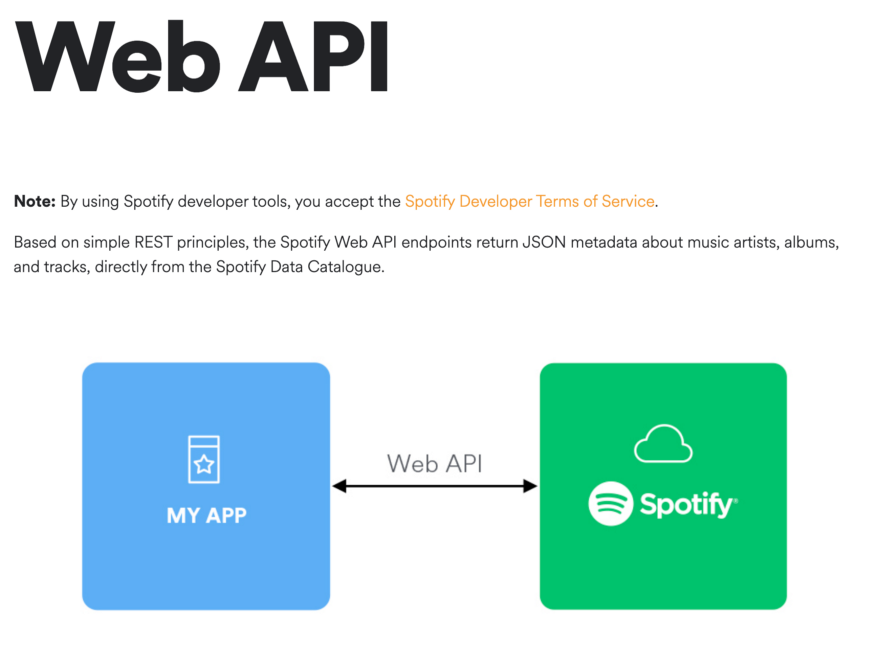
Are you a newbie to the term API and wonder what it really means? It shortcuts to a web services database. It enables coders to receive and send data without giving them complete rights to the database. Check the following figure to find what you can do with the API.
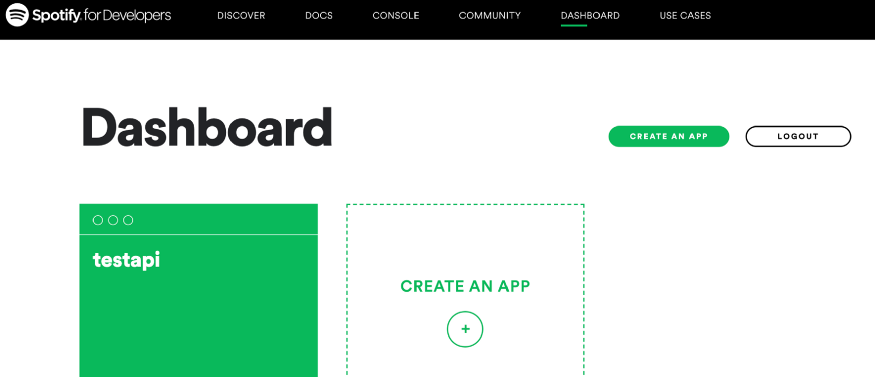
You just need to register yourself to the streaming platform. Once after completing the signup process, you can go to the dashboard. You can choose to build an app based on an effective Spotify business model. After completing the process, you get access to the secret client ID and client ID as well. Although not choosing to build the app, you need to access the client id and other data.
Data Extraction
Let’s now learn to extract the data from all songs discovered in the weekly playlist. Also, you can craft your playlist to work on various playlist data instantly. Check how you can get the playlist.
Installing Python Package
A lightweight Python library, Spotipy can be used for Web API. With the package, you can quickly get full access to music data provided by the Spotify platform. It is very easy to use. However, you can install the package using commands. !pip install spotipy.
Authorizing your Client Credential
Code for Installing Python Package
import json
import spotipy
import pandas as PD
from spotipy.oauth2 import SpotifyClientCredentials
client_id = ” #enter your client id
client_secret = ” # enter your client secret id here
client_credentials_manager = SpotifyClientCredentials(client_id, client_secret)
sp = spotipy.Spotify(client_credentials_manager=client_credentials_manager)
playlist_id=” #enter your playlist id
results = sp.playlist(playlist_id)
Converting JSON File to Dataframe
# generate a list of song ids
ids=[]
for item in results[‘tracks’][‘items’]:
track = item[‘track’][‘id’]
ids.append(track)
song_meta={‘id’:[],’album’:[], ‘name’:[],
‘artist’:[],’explicit’:[],’popularity’:[]}
for song_id in ids:
# song’s meta data
meta = sp.track(song_id)
# song id
song_meta[‘id’].append(song_id)
# album name
album=meta[‘album’][‘name’]
song_meta[‘album’]+=[album]
# song name
song=meta[‘name’]
song_meta[‘name’]+=[song]
# artists name
s = ‘:’
artist=s.join([singer_name[‘name’] for singer_name in meta[‘artists’]])
song_meta[‘artist’]+=[artist]
# explicit: lyrics could be considered offensive or unsuitable for children
explicit=meta[‘explicit’]
song_meta[‘explicit’].append(explicit)
# song popularity
popularity=meta[‘popularity’]
song_meta[‘popularity’].append(popularity)
song_meta_df=pd.DataFrame.from_dict(song_meta)
# check the features of songs right here!
features = sp.audio_features(song_meta[‘id’])
# change dictionary to dataframe
features_df=pd.DataFrame.from_dict(features)
# transfer milliseconds to mins
# duration_ms: The duration of the song in milliseconds.
# 1 minute = 60 seconds = 60 × 1000 milliseconds = 60,000 ms
features_df[‘duration_ms’]=features_df[‘duration_ms’]/60000
# combine two dataframe
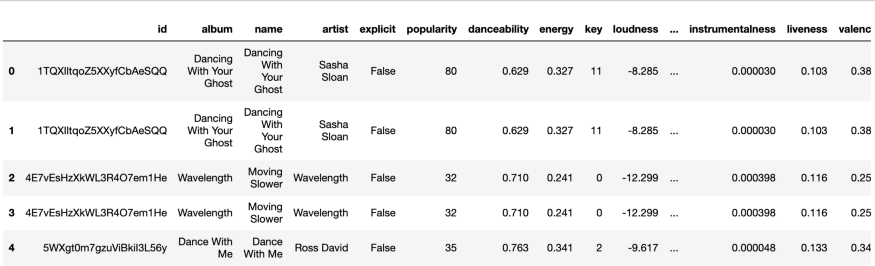
final_df=song_meta_df.merge(features_df)
Code: (Source)
Check how the data frame actually looks like
Data Preprocessing
As a show, a few of the features are small while a few are big. In such cases, considering the average values of the feature might not be comparable. Variables measured at various scales don’t contribute equally to the analysis. It will end up introducing biases. You require different methods to apply features scaling and contrast the data points.
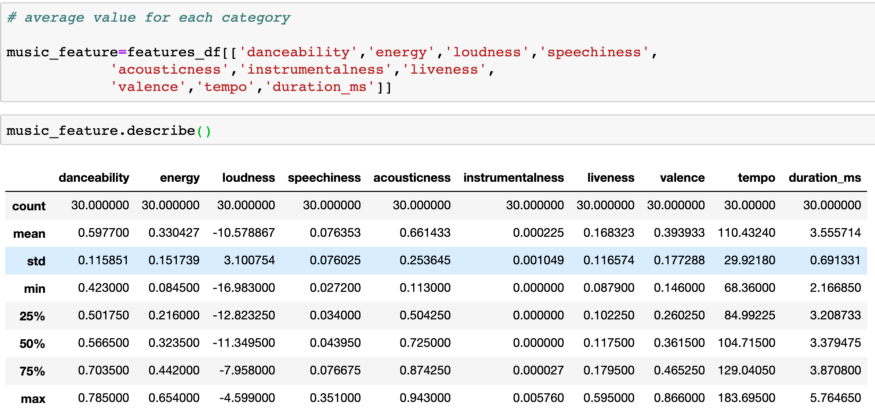
Use normalization, which is the scaling technique in which values are shifted—rescaled so that they end up ranging from 0 to 1. It’s also termed as Min-Max scaling.
from sklearn.preprocessing import MinMaxScalermin_max_scaler = MinMaxScaler()music_feature.loc[:]=min_max_scaler.fit_transform(music_feature.loc[:])
Code: (Source)
Creating a Radar Chart
Radar charts are the effects when they are analyzing different features. Based on the radar chart, you can conclude that you’re a fan of XYZ music!
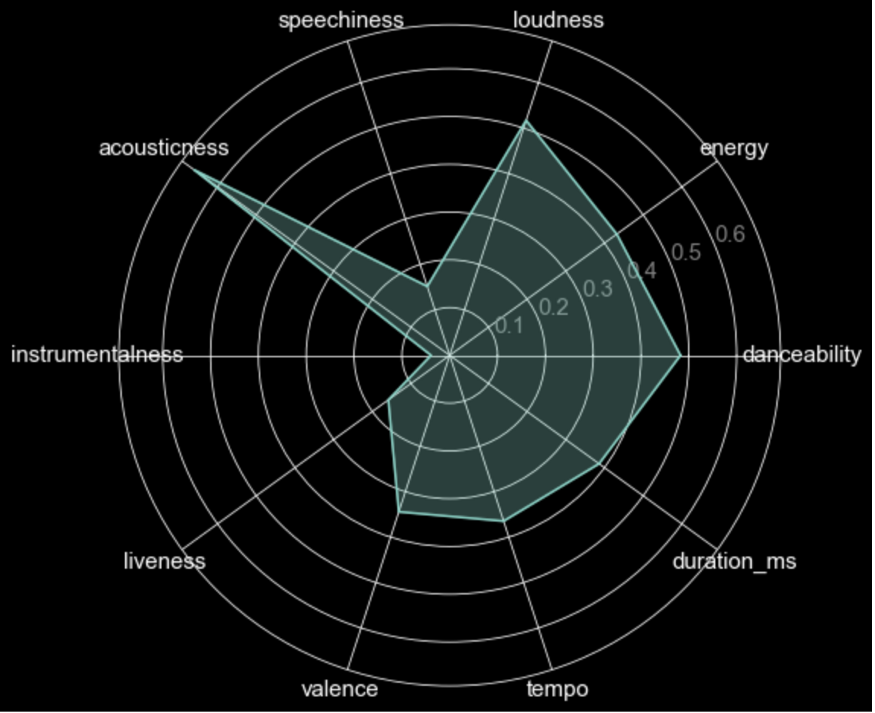
Code for Radar Chart Development!
# plot size
fig=plt.figure(figsize=(12,8))
# convert column names into a list
categories=list(music_feature.columns)
# number of categories
N=len(categories)
# create a list with the average of all features
value=list(music_feature.mean())
# repeat first value to close the circle
# the plot is a circle, so we need to “complete the loop”
# and append the start value to the end.
value+=value[:1]
# calculate angle for each category
angles=[n/float(N)*2*pi for n in range(N)]
angles f=angles[:1]
# plot
plt.polar(angles, value)
plt.fill(angles,value,alpha=0.3)
# plt.title(‘Discovery Weekly Songs Audio Features’, size=35)
plt.xticks(angles[:-1],categories, size=15)
plt.yticks(color=’grey’,size=15)
plt.show()
Code: (Source)
Summing Up!
There you get it! Now you know exactly how to extract data using API, Spotipy, and Python. You can use various ways to visualize and analyze streaming platform data including,
Developing Recommendation Engine;
Visualizing your music taste over time.
There is much more than you can know. Just keep learning, and you will definitely find new ways to discover everything right away! Happy learning!
Author Bio
 Gaurav Kanabar, founder of Alphanso Tech. He has specialized in blog writing, article writing, and copyright on different topics like the latest music industry trends, Disney+ Ott platform benefits, app development, marketing tips, and many more. Besides that, Gaurav loves spending time with nature, reading novels, and playing snooker.


