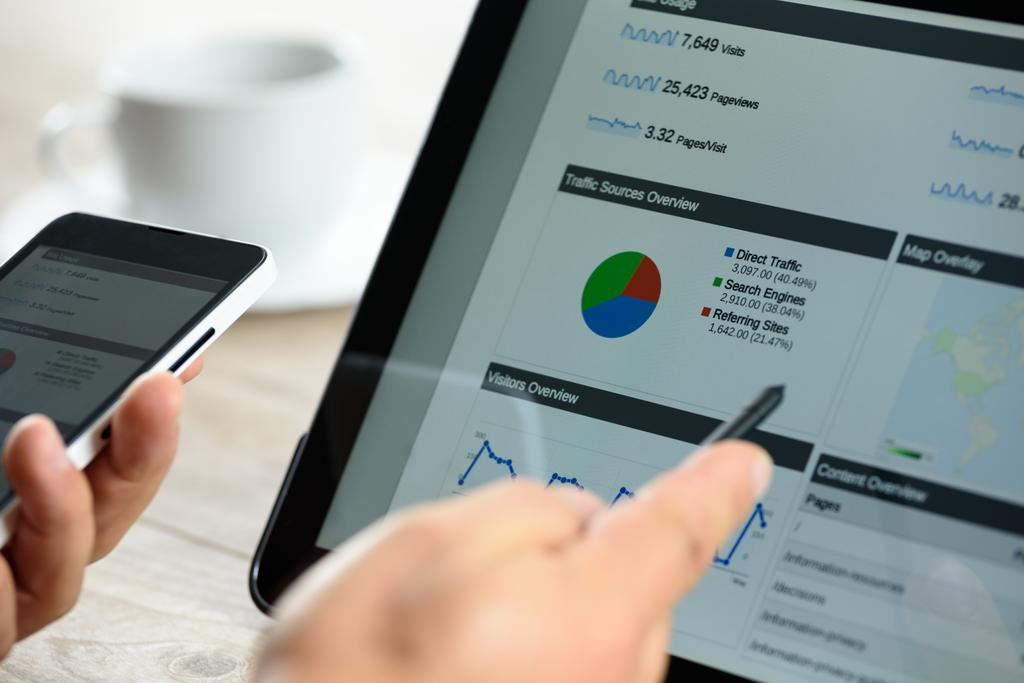
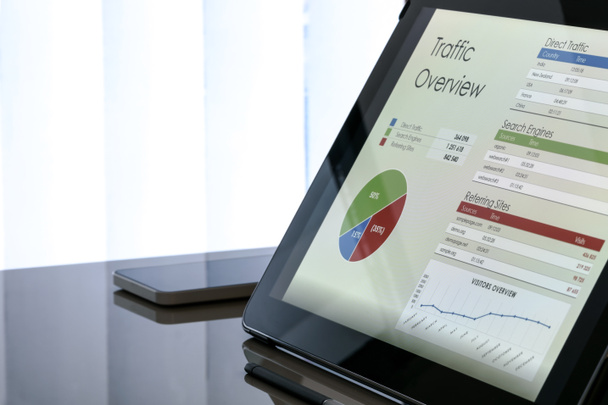
What is GA4? Google Analytics is a free service provided by Google that helps you monitor and analyze your website traffic. It’s a powerful tool that can help you optimize your website and marketing strategy. It’s easy to use and can save you time and effort. It also integrates with other Google solutions and partner products, making it an ideal tool for small and medium businesses.
Google Analytics is a free service that helps monitor the performance of websites. It also provides data on user behavior and demographics. Google Analytics 4 properties use JavaScript page tags to collect data from every visitor to a website. It then sends this data to its servers for analysis. This is how it determines data such as the average session length, page views, and other site traffic metrics.
1. Enhanced Data Modeling
The enhanced data modeling Google Analytics 4 properties have made the platform much more powerful and useful for marketers. The new version allows you to build custom dimensions or metrics, no longer requires you to set up filters, and integrates with BigQuery, making running complex queries on your data easier.
The new platform focuses on improving data collection across platforms, making it easy for marketers to predict user behavior and improve sales. In addition, it allows users to get a complete picture of the customer journey.
It also uses machine-learning algorithms to fill in gaps left by privacy regulations, browser limitations and obscured cross-device behavior. The most significant of these Google Analytics’ new features is behavioral modeling.
Behavioral modeling is a machine-learning algorithm that predicts a user’s behavior based on their past activity on your site or app. It is especially helpful in identifying who will likely buy and who will probably churn.

2. Smarter Insights
Amidst shifting consumer behavior and privacy-driven changes to industry standards, marketers need a tool that can help them understand their customers better. Google Analytics is the solution to this problem.
The new Google Analytics is designed to automatically alert marketers to significant trends in their data. This is achieved by utilizing Google’s machine learning models.
For example, the new Analytics can identify rising product demand due to a new customer need. It also helps to forecast future actions that customers may take. It can calculate churn probability so that marketers can more efficiently invest in retaining customers when marketing budgets are under pressure.
You can view the new insights on cards on your dashboard, each providing specific information you can easily drill down and analyze. Users can share links to insights or download them as PDF, PNG images, and CSV (Comma Separated Value in Excel) files.
3. Cross-Device Tracking
A major challenge for marketers is understanding how consumers interact with their products and how they move between their devices. Cross-device tracking is one way to do that.
Cross-device tracking enables businesses to track customers’ behavior across devices like smartphones and tablets. This allows them to optimize their ecommerce experiences better and increase conversion rates.
Unlike traditional web analytics, where a cookie is used to identify users, Google Analytics 4 properties use User Data, a unique ID generated for every person who visits your website or app. This ID is logged and recognized by Google Analytics whenever they visit again on the same device, whether a desktop, tablet, or mobile.
There are two kinds of cross-device tracking methods: deterministic and probabilistic. Deterministic cross-device tracking is used to identify individual visitors through their online interactions, such as an email address. On the other hand, probabilistic cross-device monitoring is based on non-personal information, such as IP addresses, operating systems, device make and model, and cookie data from website visits.

4. Event Tracking
Event tracking is a powerful analytics technique that allows you to track a wide range of on-page interactions that don’t necessarily involve a user moving to another page. These include downloads, mobile ad clicks, gadgets, and video plays.
To set up event tracking, add a snippet of custom code to the link code on each item you want to track. When the item is clicked, Google Analytics 4 properties will recognize it and display it as an event in your analytics property.
You can also assign an event value to it to measure its business value quantitatively. However, this can mislead you if you don’t have context and historical data to back up the value you’re placing on it.
Events in Google Analytics 4 are organized by a series of levels, starting with Category (highest level) and getting more specific and granular from Action to Label and Value. These are important to know when setting up your events, as they help you keep things clear and logical in reports.
5. User-Centric Measurement
Google Analytics 4 offers an enhanced set of user-centric metrics that help you understand and improve your customer journey. These are designed to unify, de-duplicate, and analyze users’ interaction with your business across devices and platforms.
These Google Analytics metrics provide a complete view of your customer’s online activity and allow you to predict the likelihood of generating revenue from them. This is a significant change from the previous measurement fragmented by device or platform, which made it hard to see how your customers interact with your brand across the customer lifecycle.
Unlike session-based analytics, user-centric ones are based on user IDs, not cookies. This allows you to recognize each user even when they use a different browser or device or delete their cookies. Using this data can help you increase conversions, improve retention rates, and increase the lifetime value of your customers.
6. Deeper Integration with Google Ads
Marketers worldwide use Google Ads to expose their products and services to potential customers. The platform offers powerful insights such as cost per click, ad quality score, and conversion rates to help them maximize their advertising budget.
However, marketers want more than just the basic metrics that Google Ads offers. They also need to be able to track the exact ROI of their ads so they can engage in revenue-driven marketing. This is where integrations come in handy. They allow you to share Analytics audiences with Google Ads to deliver messaging tailored to different groups of customers.
For example, if you have an audience of users who filled a cart on your site but abandoned it before completing the purchase, you can create campaigns in Google Ads targeting these people. This is great for retargeting and helps deliver relevant messaging to your website visitors. In addition, it makes it easier for you to monitor your marketing performance on a granular level.
7. Advanced Audience Segmentation
Audience segmentation is a powerful tool for dividing your audience into smaller groups. This helps you personalize your marketing efforts and deliver relevant content to different audiences.
Audience segments can be based on demographic, geographic, or behavioral data. Using the correct segmented audience can drive better results, including higher customer satisfaction and engagement.
Advanced audience segmentation capabilities include conditional and sequential segments, which allow you to cut up data to create more granular reports. This is particularly useful for understanding the behaviors of new users who interact with your website.
For example, if you notice that a subset of your site visitors purchases far more than the rest of your users, you can use segmentation to target them with targeted promotions.
You can use this powerful feature to improve conversion rates and reduce churn. You can also use it to target consumers likely to buy again in the future, which can increase your ROI.
8. Real-Time Data Analysis
Real-time data analysis allows businesses to capture and analyze data as it happens. This means identifying and targeting customers at exactly the right time. It also helps to track and control business processes. For example, manufacturing plants can use real-time analytics to detect faults in their machines and notify the right people about these issues.
Another use case is to collect and analyze system logs, which you can use to pinpoint performance bottlenecks and resolve them before they cause downtime. You can source this data from CRMs, ERPs, machine sensors, cameras, and additional devices installed in your facility.
The data can then be stored in a database or on the cloud and analyzed as it’s generated or pushed into the system. The data can either be streamed in real-time or queried from the data warehouse at a predetermined interval (say, every 30 minutes).
You can request real-time reports displaying event data from the last five minutes using Google Analytics’ new features API. You can use this to test whether your campaigns are set up correctly or to see whether your site performs well.
9. Predictive Metrics
Predictive Google Analytics metrics allow marketers to make data-driven decisions about their marketing campaigns based on historical data and events. They also help companies streamline operations and boost revenue for almost any industry.
For example, if you run an e-commerce site, predictive metrics can help you identify users who are likely to make purchases in the next seven days. You can then create a campaign to capture these customers and increase conversions.
Similarly, predictive analytics can help you maintain equipment and machinery in asset-intensive industries such as healthcare and manufacturing to avoid downtime and unnecessary expenses. In this way, you can reduce costs and extend the lifespan of your assets.
Google Analytics 4 supports predictive metrics, making it easier for organizations to track customer behaviors and predict future trends. This functionality is powered by big data machine learning and artificial intelligence models.
10. Customizable Dashboards
Customizable dashboards allow you to view the Google Analytics metrics that matter most to you in one place. They can also help you organize your data in a way that makes sense. Using Google Analytics templates is an option, but you can also create your dashboard from scratch. However, you should define your objectives first to prioritize which metrics you want to display.
To create a new dashboard, navigate to Customization > Dashboards, then click on the Create button. In the menu that opens up, select a template and name it. If you choose the Starter Dashboard, it will come with a pre-set set of starter widgets.
You can add up to 12 widgets on a dashboard, including maps, bars, pie, metric, timeline, and table widgets. You can also send the data from your Google Analytics dashboard to your email regularly to track how it changes over time.
11. Enhanced eCommerce Tracking
With the depreciation of Universal Analytics in 2023, businesses need to start thinking about moving to Google Analytics 4. The latest version of Google Analytics, GA4, offers cross-platform insights into all aspects of the digital customer journey. It includes conversion tracking, app data, and more.
Enhanced eCommerce is a special feature in GA that allows you to track product impressions, and detail views, add/remove a product to the cart, promote impressions and clicks, and measure every step of the checkout process, including purchases and refunds, and export to BigQuery for further analysis.
In addition, the extension also provides user timings reports to measure periods for customers to perform a certain action on your site. This allows you to optimize your website and increase sales and profit.
The nopStations Google Analytics 4 plugin for nopCommerce makes enabling and managing GA4 on your nopCommerce store easy. It also includes a GTM API implementation allowing automatic configuration of tags, triggers, and variables with the click of a button.
12. Session-Based Attribution
Session-based attribution gives insight into how long a visitor interacts with your site and how you can increase the average session duration and improve your conversion rate. In GA4, a session is when a user makes a series of actions on your site in 30 minutes, including multiple pageviews, clicks, and transactions. A ‘user’ is the visitor who initiated the session.
The distinction between the two is important because you can treat users as the number of unique visitors to your site, but this could be misleading in certain situations. For example, if a user visits your site on different devices or browsers, deletes cookies, or uses private mode, they will have multiple sessions.
In Google Analytics, new features make attribution modeling more accurate and user-centric. For example, the first user source (source of the first visit) is a new feature that shows where a user came from for the first time.
13. User Privacy Controls
Google Analytics’ new features help users comply with the latest privacy laws. These include default IP anonymization, shorter data storage duration, location of servers and restricted data transfer, consent mode, users’ data deletion, rules regarding PII, and more.
You can adjust user privacy controls anytime by navigating to the “Admin” section and clicking on the “Data Settings” tab. From here, you can decide how you share data with Google, choose your ads’ personalization settings, and remove data from Analytics.
As with Universal Analytics, Google Analytics 4 allows you to specify a retention period for user and event data. After that period, data will automatically be deleted from your account and Google’s servers.
This makes meeting the GDPR and CCPA privacy requirements easy by using Analytics on your website. The GA4 Admin API also supports deleting data for a single user based on their Client ID or App Instance ID. Alternatively, you can disable advertising features programmatically based on the expressed privacy preferences of the user.
14. Data-Driven Attribution
Data-driven attribution is a great tool that helps marketers understand the role that different touchpoints play in conversions. You can use this to distribute ad spending better and improve your ROI.
Google Analytics 4’s Data-Driven Attribution modeling aims to solve the shortcomings of traditional attribution models and provides more insight into customer journeys. Using machine learning, it gives credit where it’s due, allowing digital marketers to allocate their marketing budget more effectively.
Unlike position-based attribution models, which give credit to the last click that brought the user to your site or app, data-driven attribution uses a Markov chain model to determine which touches contribute to a purchase. It also assigns a different weighting to different interactions contributing to a conversion.
To use this type of attribution, you need access to a Google Analytics 360 or Premium account. This is necessary because your account needs to have enough historical data in it to be able to analyze and learn from the data properly.
15. Data Sharing and Collaboration
GA4 includes a variety of data sharing and collaboration options, allowing agencies to customize their analytics tracking for individual clients. This helps agencies track goals across all devices, create custom events, and better understand the customer journey.
Moreover, Google Analytics allows for secure data exchange via its Analytics Hub. This solution makes it easy to share a range of data assets, such as Google Trends and web clickstreams.
Businesses can collaborate on shared data to surface previously hidden insights, enabling them to unlock new opportunities and improve performance. This is possible because when data is collaboratively shared, it aligns the perspective of everyone involved, allowing the teams to generate consistent insights as quickly as possible.
According to a report by Gartner, organizations that promote data sharing and collaboration will achieve higher business success than those that don’t. This is because shifting from the traditional “don’t share data” mindset to a “must share data unless it satisfies regulatory requirements and data protection standards” can help unearth many new opportunities.
Conclusion
There is a lot of data to sift through, so Google Analytics has got you covered. Using the data provided by this analytics platform will allow you to make smarter business decisions and save your marketing budget. Google Analytics’ new features are well-suited for both small and large businesses alike.
Exceptional functionality comes from data import, custom Google Analytics metrics, and visualization tools. The most important function, however, is the ability to interact with your data in the most meaningful way possible. The best example is the data explorers dashboard, where you can view your data in a single, clear, and tidy package. Moreover, you can use this dashboard to get an overview of your entire digital portfolio. This is a major time saver and can be implemented in a fraction of the time it takes to manually navigate your way through each data collection point.
AUTHOR BIO
Edwin Brown is working with Morningdove Marketing, a digital marketing firm located in the USA. He is devoted to finding avant-garde solutions for SEO and digital marketing challenges and enjoys sharing his knowledge with those in need.


