

Price Action Trading refers to trading based on the recent price movements of the security or the financial instrument. In this, subjective trading decisions are made based on the recent changes in the prices of the shares. It is a strategy that relies on the technical analysis of shares.
Investors use this strategy to generate profit in the short term. One must consider various tools such as price charts, price bands, trend lines, high and low swings, and technical levels such as support, resistance, and consolidation. You can engage in price action trading when doing online stock trading.
Price Action Trading varies from trader to trader and depends on each one’s subjective analysis. Two traders can come to entirely different conclusions in this concept.
Market Trend’s Influence on Price Action Trading
- Price Action Trading studies the trend of prices in the market. For instance, traders chase price action trends as they become visible. Buy positions are opened based on green uptrends and sell positions from red downtrends.
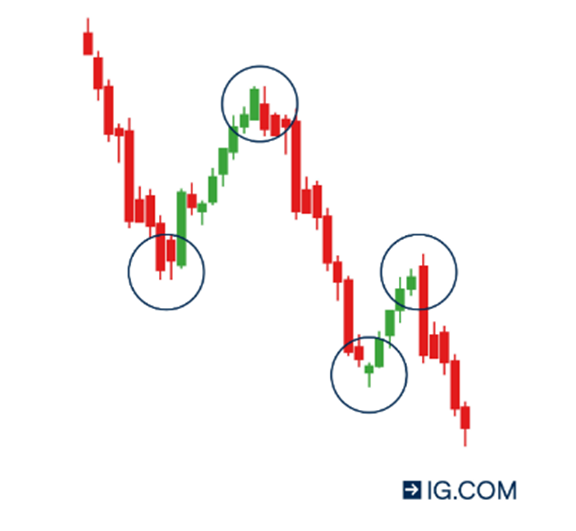
- Pin bars are candlesticks that look like a candle with a long wick at its end. The wick shows prices that the market rejected and will indicate whether one should take long or short positions in the market.
If the wick is a longer lower tail, then there is a large possibility that prices are about to rise. Therefore, you should monitor pin bars when you are online stock trading.
- Inside bars are smaller bars confined inside an outer, larger bar that signal shifts in the trends. This aspect could mean a consolidation or a shift in the trend. It indicates whether the trend is moving up or down.
- There is a retracement entry. If the price turns downwards, with lower high prices being made each time, the trader may take a short position. But if prices are making higher highs and lows, the trend is turning upwards, signaling a need to take a long position.
- If there is a breakout entry, the subsequent trend analysis: After a major upward or downward movement, there is a possibility of a trend change in the opposite direction.
If the price crosses a major resistance or a support level, this is called a price breakout. If it crosses the resistance line in the upward direction, you should take a long position. If there is a breach of downward support, the signal is to take a short position.
- There is a reversal of a head and shoulders pattern.
As the name itself suggests, the price movement in a head and shoulders pattern resembles a human head and shoulders pattern. There are two small humps on either side to mirror the two shoulders and a large hump in the middle to represent the head.
The first shoulder normally signals entry and exit at the downward curve of the second shoulder to take advantage of the rise in between the two shoulders or the movement mirroring the head.
- Analyzing the sequence of highs and lows: A sequence of higher highs and higher lows or vice versa enables market traders to map the price trends in the market. It enables traders to choose entry and exit points.
Key Takeaways
Price trend analysis monitors actual price movements in the market. It helps traders to predict market movements and make short-term gains. You can learn to analyze price trend movements by executing price action trading through your online stock trading app.


